Navigating the PSR: Job Metrics Trending
About:
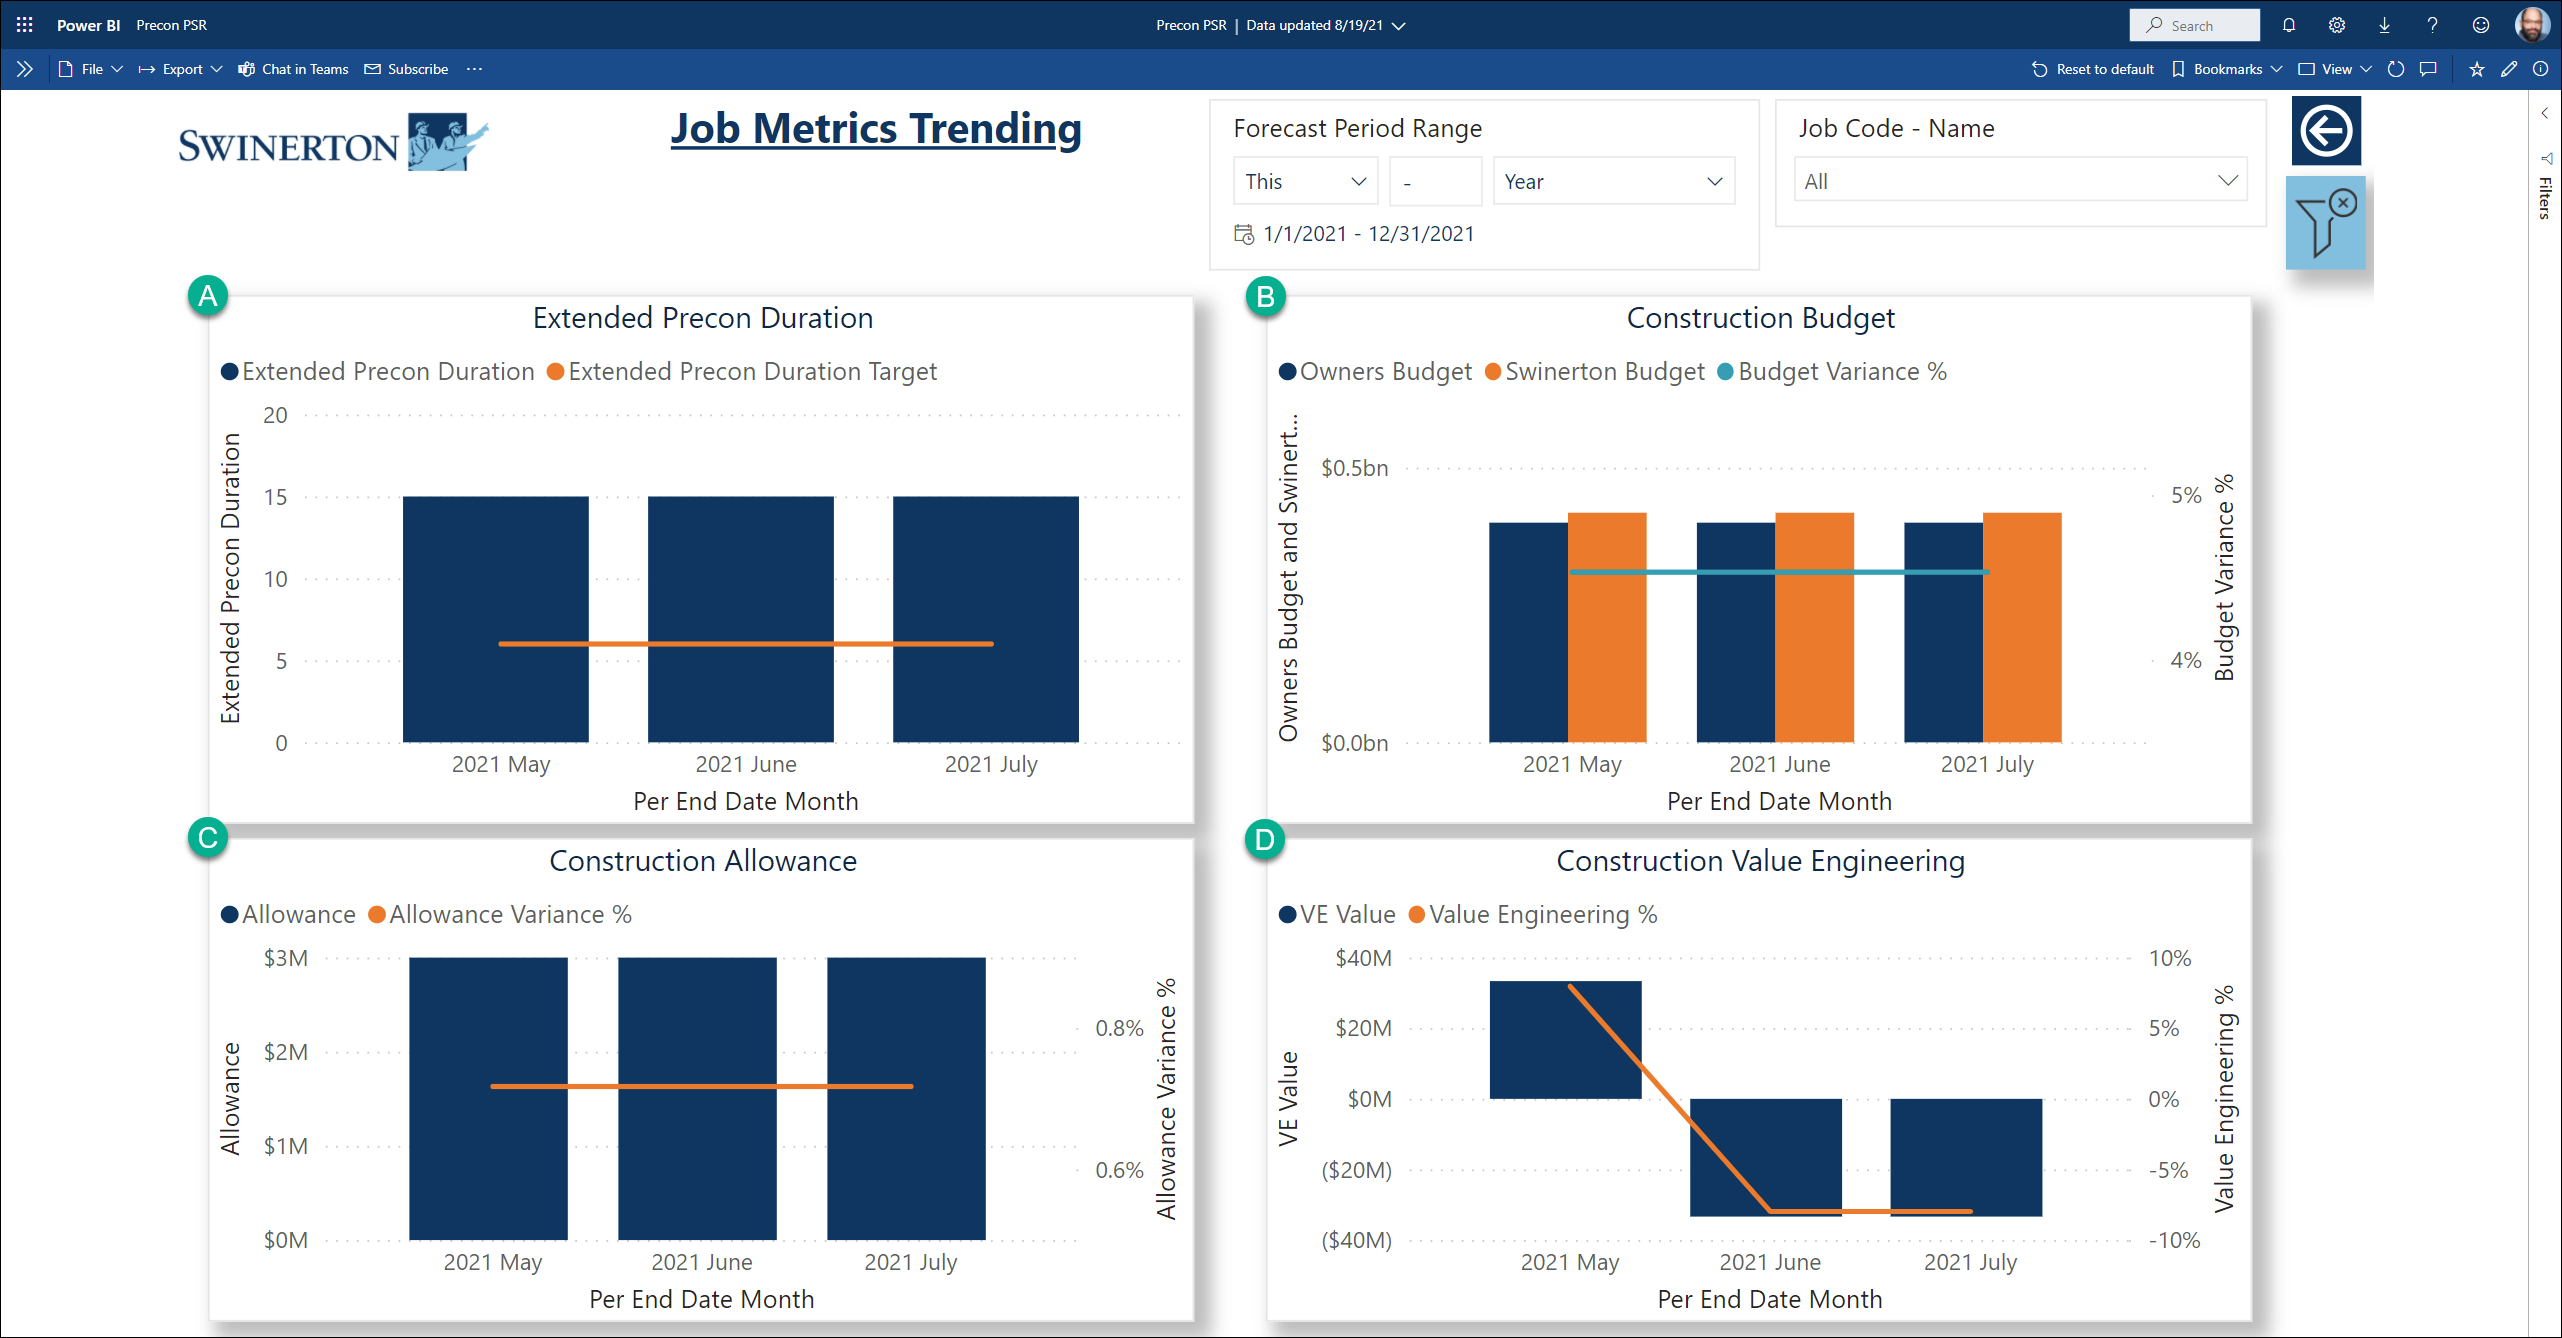
This page shows trends for jobs over the monthly periods. You get to the page by drilling through from "Regional Summary". For this page, it is not necessary to select a specific Job, Year and Month because we are showing aggregate trends.
Below this image is a reference table for each visual on the page, lettered A - D.
Visual ID
Description
How to interpret
A
Extended Preconstruction Duration
This is the total of all the Extended Precon Duration metric for the Jobs selected and how they compare to the target of 6 months * the number of jobs selected. The target increases/decreases based on how many jobs you have selected with the various filters.
B
Construction Budget
This chart shows how we are progressing in meeting the Owner’s budget expectations.
- The column charts show the Swinerton Construction Budget vs the Owners Budget.
- The line graph shows the Budget Variance %
C
Construction Allowance
This chart shows how the total construction allowance is decreasing or increasing relative to Swinerton’s budget
D
Construction Value Engineering
This chart shows the trending % of Construction Value Engineering vs Swinerton’s Budget during Preconstruction