Navigating the PreCon PSR: Regional Summary
About:
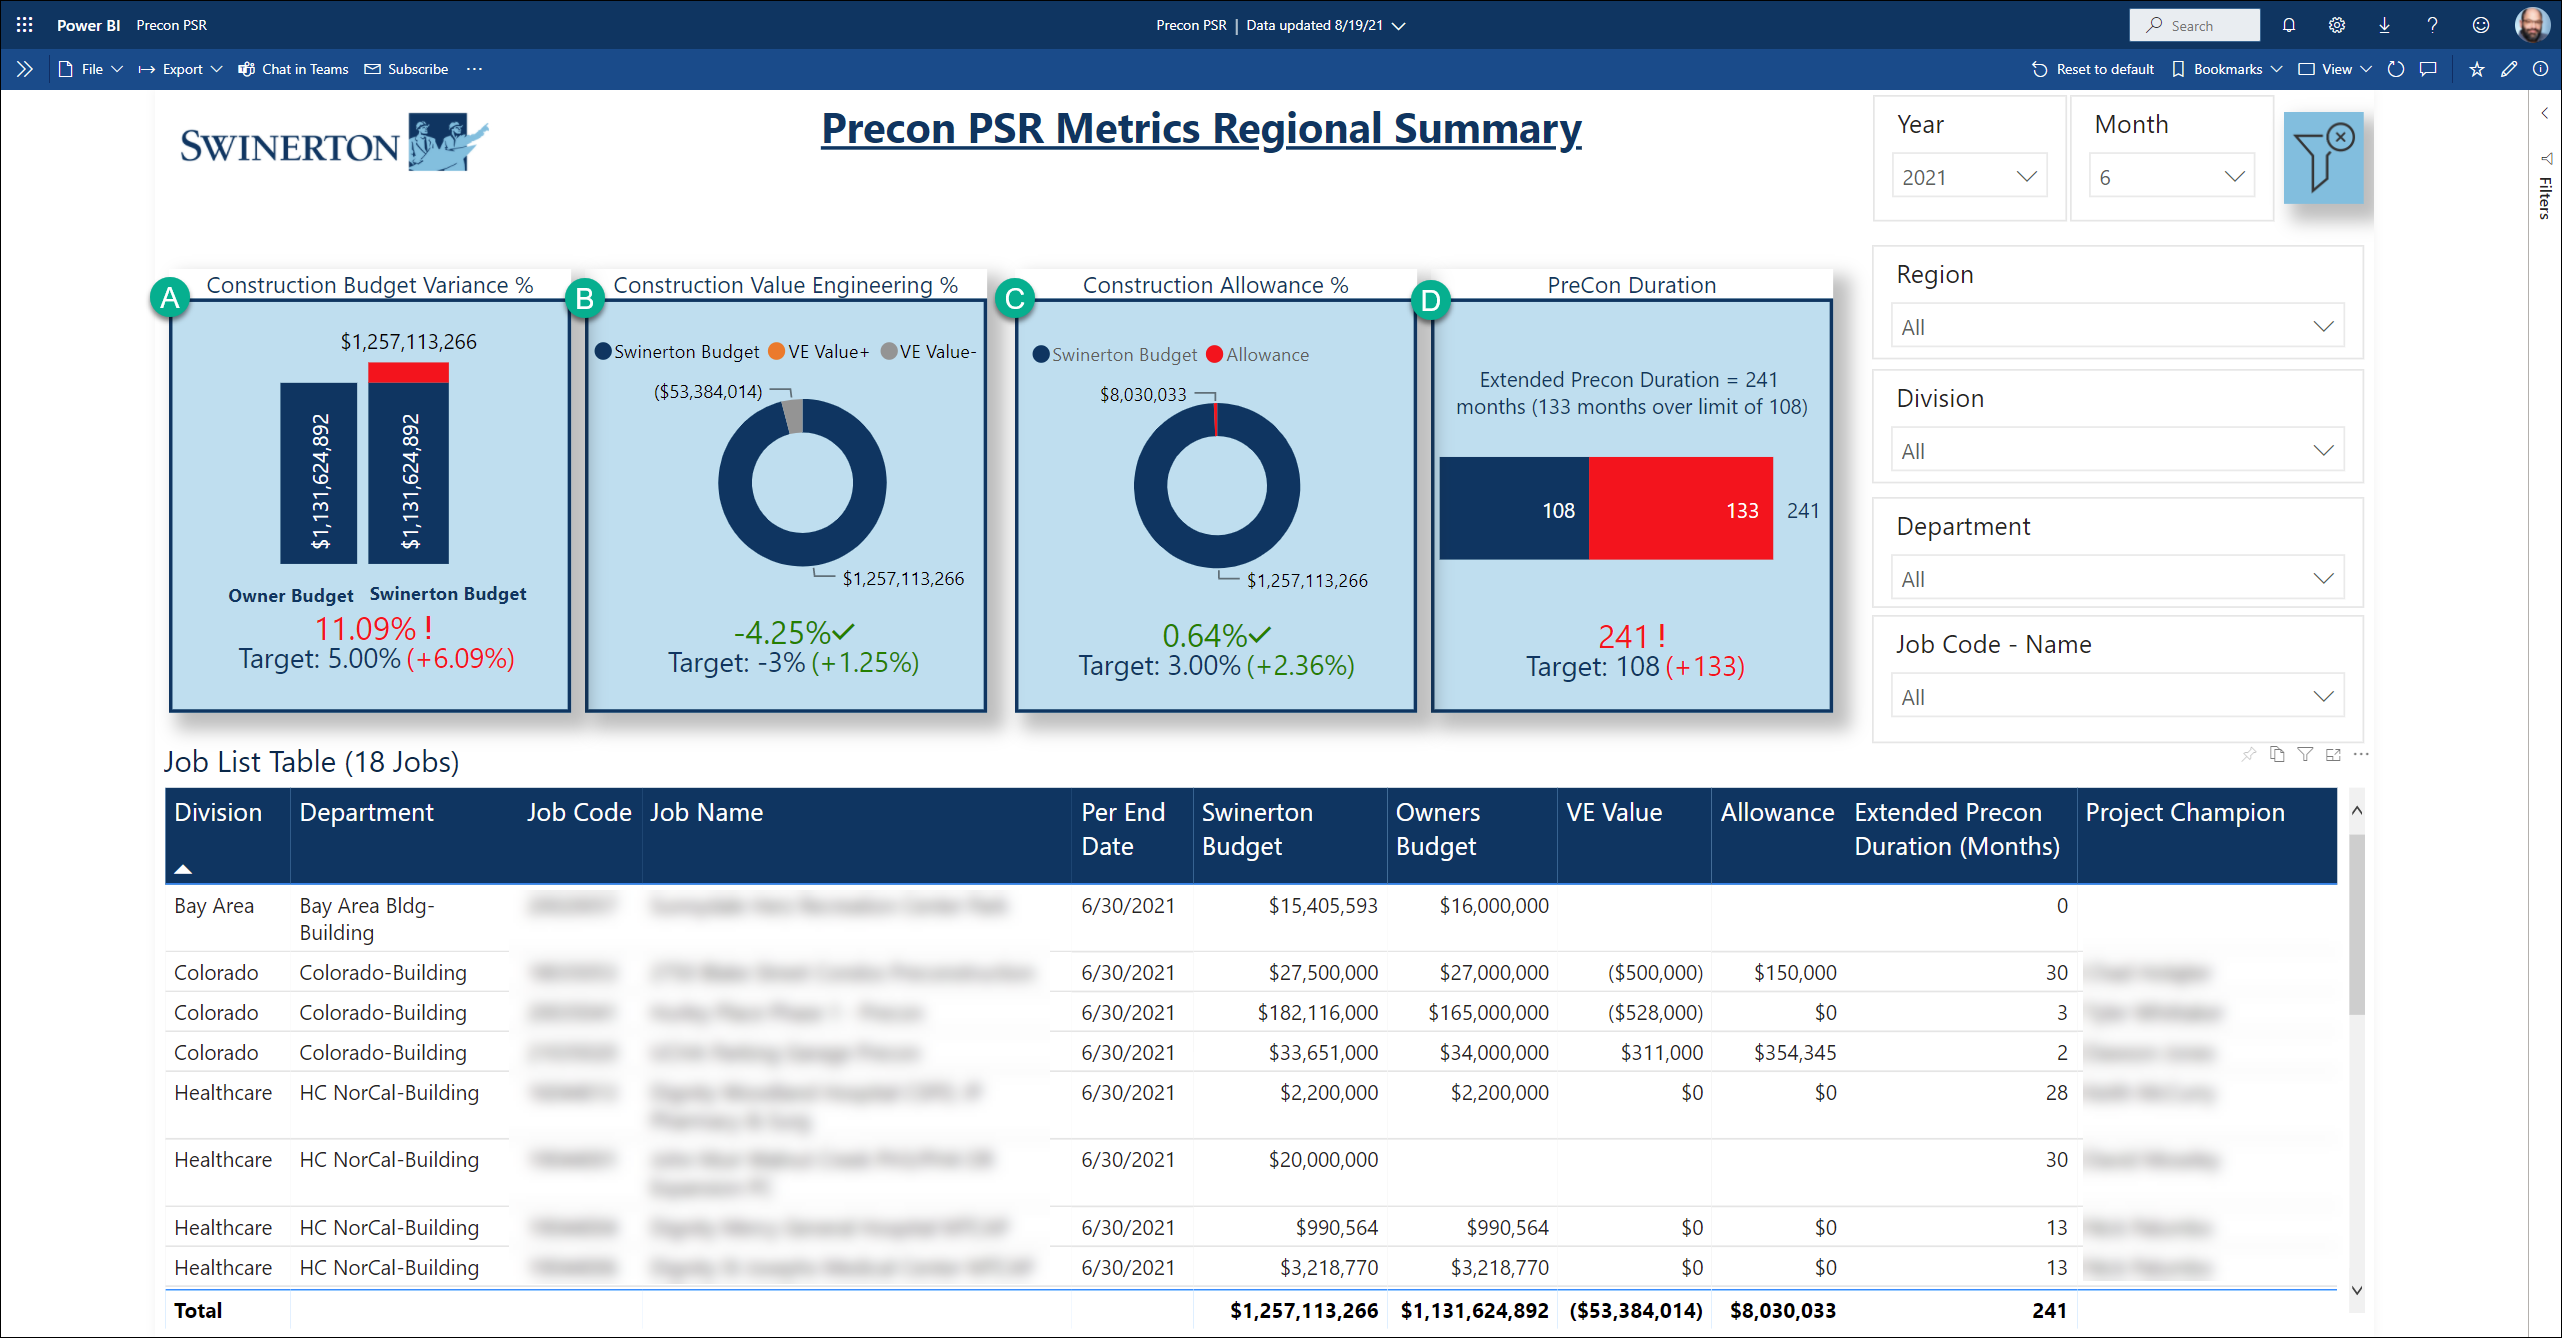
This is the main page where you will start by default. From here you can drill through to other pages and visualize metrics on a regional, division and department level for a selected year and month. For all visuals on this to make sense, please remember you need to select a Month, and Year to specify the point in time for reference. All visuals can be interpreted at a Regional, Divisional, Department, and Job level.
Below this image is a reference table for each visual on the page, lettered A - D.
Visual ID
Description
How to interpret
A
Construction Budget Variance %: Is Swinerton's budget in alignment with the Owner?
< 5% = Target, Green
< 10% Orange, OK
>= 10% = Bad Red
Visual will show absolute variance in red if over 5%, green if under %
B
Construction Value Engineering %: What percent of the overall Swinerton Budget is Value Engineering?
< 3% = Target
< 5% = Good
>= 5% = Bad
C
Construction Allowance %: What percent of the overall Swinerton Budget is an Allowance?
< 1% of budget = Target
> 3% of budget = Bad
D
PreCon Duration: The cumulative total difference from the Precon start to the projected Precon completion date for all Jobs selected. The target is = 6 * number of jobs we are examining for a specified period.
Red: if the cumulative PreCon Duration is more than 6 months * target
Green: if the cumulative PreCon Duration is less than 6 months * target