What I Need to Know: Dashboard Viewing Guide
Awarded Projects (Closed Only) Snapshot (YTD)
-
Shows: Official Closed Dales for the Division/Office or Region Noted
-
Time Frame: The Current Calendar Year
-
Note: Resets to zero Jan 1st of every year. Hit Ratio and Counts are determined off both number of won/lost Opportunities and $ value of won/lost opportunities

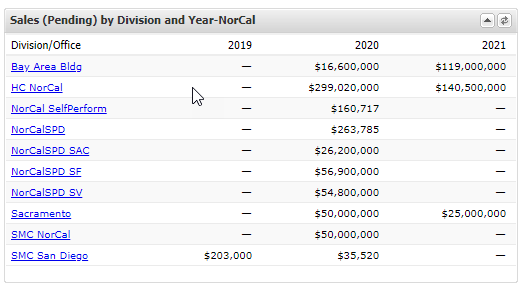
Sales (Pending) by Division and Year
-
Shows: All 10a-Pending Sales for the Division/Office or Region and Year Noted
-
Time Frame: No Time Limit
-
Note: This is to provide a visual cue of pending sales and wat year they were logged. The goal is to ensure that pending sales are moving to closed sales to previous years eventually zero out.
Sales (Closed) by Division YTD and Last Year Comparison
-
Shows: All 10b-Closed Sales, or what is counted on the official company sales report, for the Division/Office noted. (This widget breaks out each Division/Office in the region and only shows up on the regional dashboards.)
-
Time Frame: The previous year and the current year to allow comparison year over year.
-
Note: This only show the past year and the current year and will switch over January 1st every year. This widget can also be shown as a column or stacked chart to compare year over year.

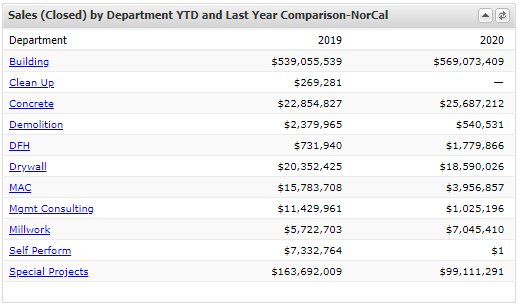
Sales (Closed) by Department YTD and Last Year Comparison
-
Shows: All 10b-Closed Sales, or what is counted on the official company sales report, for the Departments in all Division/Offices in the Region noted.
-
Time Frame: The previous year and the current year to allow comparison year over year.
-
Note: This only show the past year and the current year and will switch over January 1st every year. This widget can also be shown as a column or stacked chart to compare year over year.
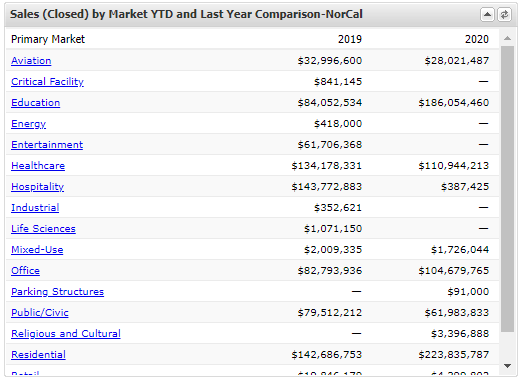
Sales (Closed) by Market YTD and Last Year Comparison
-
Shows: All 10b-Closed Sales, or what is counted on the official company sales report, for the Primary Markets across all Departments throughout Division/Offices in the Region noted.
-
Time Frame: The previous year and the current year to allow comparison year over year.
-
Note: This only show the past year and the current year and will switch over January 1st every year. This widget can also be shown as a column or stacked chart to compare year over year.
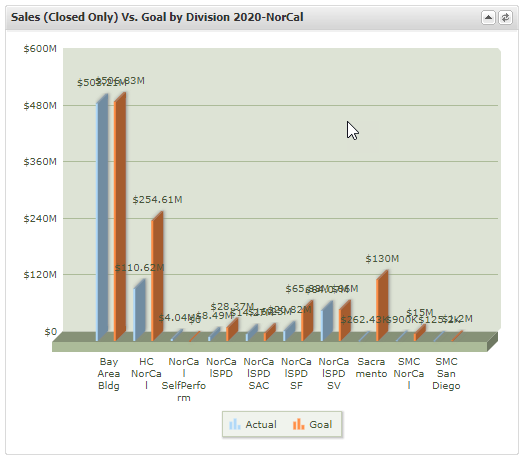
Sales (Closed Only) vs. Goal by Division 2020
-
Shows: Sales goals, as established in the Division/Office's business plans, versus actuals (10b-Sales Closed) for those Division/Offices noted.
-
Time Frame: The calendar year noted in the title which corresponds to the business plan goals for that year (in the case 2020)
-
Note: Sales will not be pulled into this Widget if there isn't a goal established. As such, you might see a variation in the official sales versus the totals depicted here.
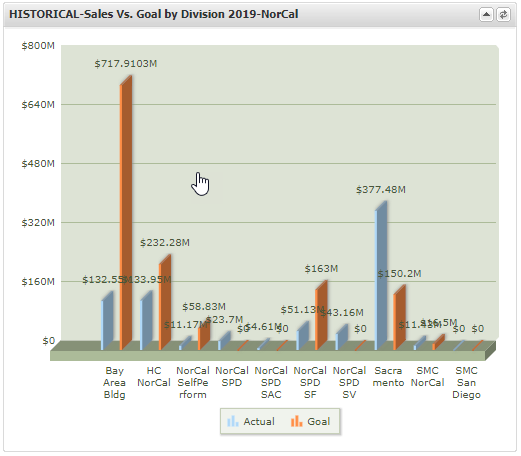
HISTORICAL - Sales vs. Goal by Division
-
Shows: Historical sales goals, as established in the Division/Offices' business plans, versus actuals (10b-Sales Closed) for those Division/Offices noted.
-
Time Frame: The calendar year noted in the title which corresponds to the business plan goals for that year (in this case 2019).
-
Note: Sales will not be pulled into this widget if there isn't a goal established. As such you might see a variation in the official sales versus the totals depicted here.
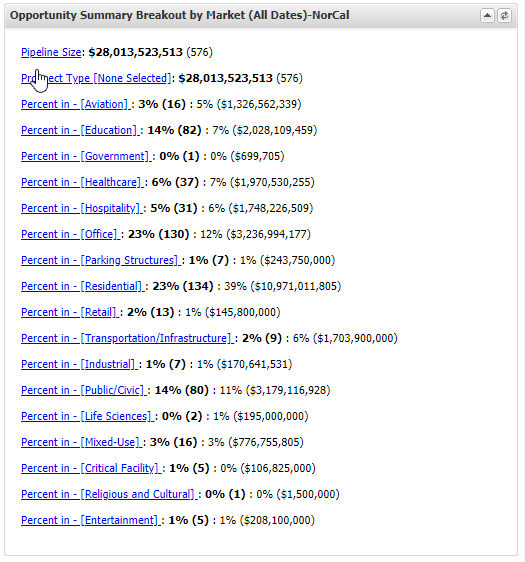
Opportunity Summary Breakout by Market (All Data)
-
Shows: All "Open" opportunities (not sales, losses, no-go's, or owner cancelled) by market for the Region, Division/Office, and Department noted.
-
Time Frame: No Time Frame (i.e.: Everything in the system regardless of date).
-
Note: Prospect Type isn't used and can be ignored.
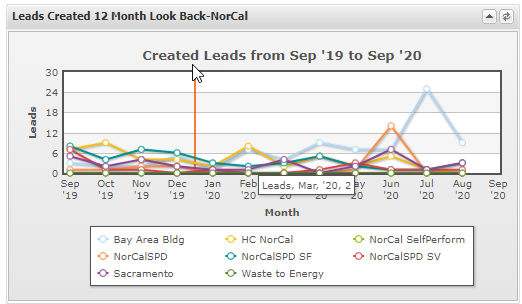
Leads Created 12 Months Look Back
-
Shows: How many leads have been created by the Division/Office.
-
Time Frame: The past 12 months (including this month).
-
Note: You can turn off the legends to focus down on a specific element by clicking on any item in the legend.
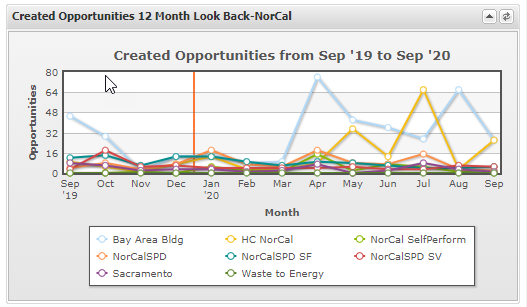
Created Opportunities 12 Month Look Back
-
Shows: How many opportunities have been created by the Division/Office.
-
Time Frame: The past 12 months (including this month).
-
Note: You can turn off the legends to focus down on a specific element by clicking on any item in the legend.
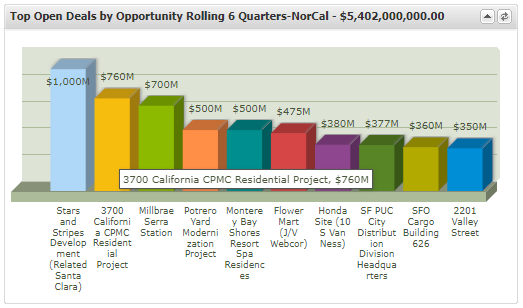
Top Open Deals by Opportunity Rolling 6 Quarters
-
Shows: Top 10 Opportunities ranked by the Potential Swinerton Revenue Field
-
Time Frame: One quarter prior, the current quarter, and five quarters out.
-
Note: This widget populated based on Opportunities' Anticipated Award Date so it is important to ensure you are constantly updating $ values and the Anticipated Award Date.
Market Pipeline $'s by Market Rolling 6 Quarters
-
Shows: Projected Opportunity Pipeline for the Markets and Division/Office or Departments noted. The dollars are populated from the Swinerton Potential Revenue field.
-
Time Frame: One quarter prior, the current quarter, and five quarters out.
-
Note: This widget populated based on Opportunities Anticipated Award Date (AAD) so it is important to ensure you are constantly updating $ values and the AAD. It shows the previous quarter so you can visually ensure your AADs are up to date as the previous quarter should have a zero. This ensures an accurate pipeline projection for the executive committee and our sureties.

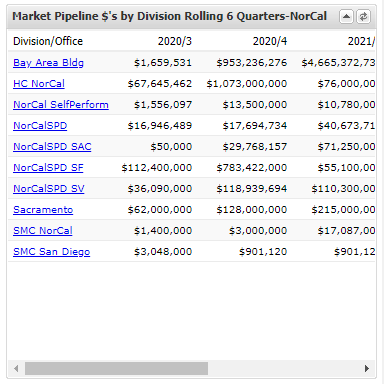
Market Pipeline by $'s by Division Rolling 6 Quarters
-
Shows: Projected Opportunity Pipeline for the Divisions noted. The dollars are populated from the Swinerton Potential Revenue field.
-
Time Frame: One quarter prior, the current quarter, and five quarters out.
-
Note: This widget populated based on Opportunities Anticipated Award Date (AAD) so it is important to ensure you are constantly updating $ values and the AAD. It shows the previous quarter so you can visually ensure your AADs are up to date as the previous quarter should have a zero. This ensures an accurate pipeline projection for the executive committee and our sureties.
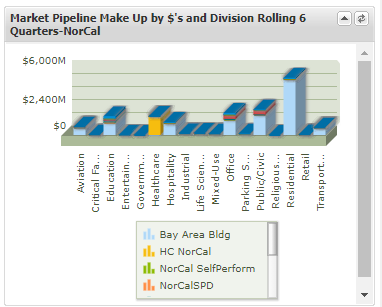
Market Pipeline Make Up by $'s and Division Rolling 6 Quarter
-
Shows: Column Chart of the total pipeline stacked by the Division/Office or Department noted.
-
Time Frame: One quarter prior, the current quarter, and five quarters out.
-
Note: This widget populated based on Opportunities Anticipated Award Date (AAD) so it is important to ensure you are constantly updating $ values and the AAD. This ensures an accurate pipeline projection for the executive committee and our sureties.
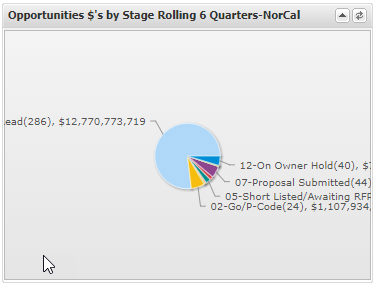
Opportunities $'s by Stage Rolling 6 Quarter
-
Shows: How many opportunities (count and dollars) are in a specific stage for the Division/Office or Departments notes.
-
Time Frame: One quarter prior, the current quarter, and five quarters out.
-
Note: This widget populated based on Opportunities Anticipated Award Date (AAD) so it is important to ensure you are constantly updating $ values and the AAD.
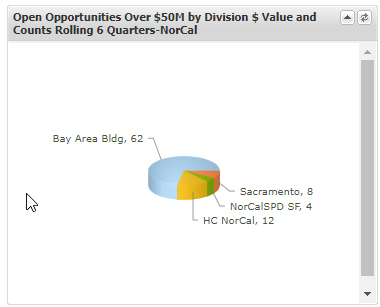
Open Opportunities Over $50M by Division $ Value and Counts Rolling 6 Quarter
-
Shows: Shows number of opportunities over $50M for the Division/Office or Department noted. (You can hover over the pie pieces to see $ values).
-
Time Frame: One quarter prior, the current quarter, and five quarters out.
-
Note: This widget populated based on Opportunities Anticipated Award Date (AAD) so it is important to ensure you are constantly updating $ values and the AAD. This ensures an accurate pipeline projection for the executive committee and our sureties.
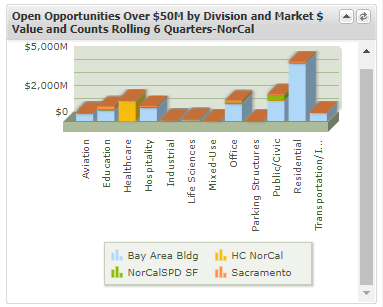
Open Opportunities Over $50M by Division and Market $ Value and Counts Rolling 6 Quarter
-
Shows: Shows number of opportunities by Primary Market over $50M for the Division/Office or Department noted. (You can hover over the pie pieces to see $ values).
-
Time Frame: One quarter prior, the current quarter, and five quarters out.
-
Note: This widget populated based on Opportunities Anticipated Award Date (AAD) so it is important to ensure you are constantly updating $ values and the AAD. This ensures an accurate pipeline projection for the executive committee and our sureties.
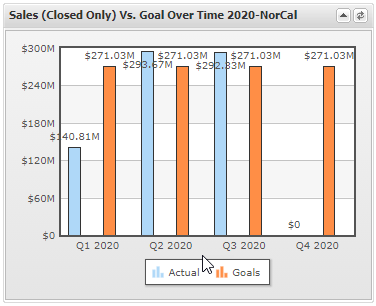
Sales (Closed Only) Vs. Goal Over Time 2020
-
Shows: Sales goals straight lined by quarter, as established in the Division/Office's business plan versus actuals (10b-Sale Closed) for the Division/Office noted.
-
Time Frame: The calendar year noted in the title which corresponds to the business plan goals for that year (in this case 2020).
-
Note: Sales will not be pulled into this widget if there isn't a goal established. As such, you might see a variation in the official sales versus the totals depicted here.
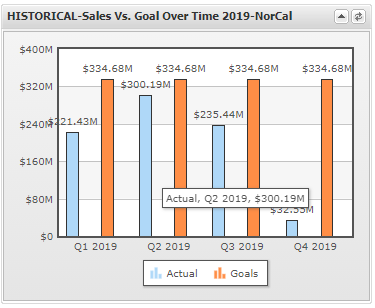
HISTORICAL Sales (Closed Only) Vs. Goal Over Time 2019
-
Shows: Sales goals straight lined by quarter, as established in the Division/Office's business plan versus actuals (10b-Sale Closed) for the Division/Office noted.
-
Time Frame: The calendar year noted in the title which corresponds to the business plan goals for that year (in this case XXXX).
-
Note: Sales will not be pulled into this widget if there isn't a goal established. As such, you might see a variation in the official sales versus the totals depicted here.
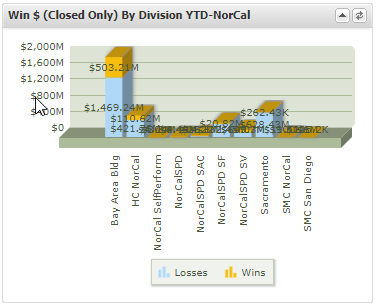
Win $ (Closed Only) By Division YTD
-
Shows: Split of wins/losses by dollar value for the Division/Offices noted.
-
Time Frame: Current calendar year.
-
Note: Because we uploaded only wins before go live, the actual win rate before October 2019 is skewed. However, moving forward this will be much more accurate. You can look at any duration and express this as a % by count of opportunities as well.
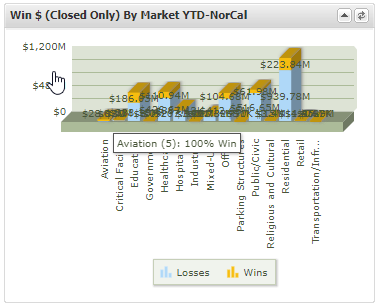
Win $ (Closed Only) By Market YTD
-
Shows: Split of wins/losses by dollar value for Primary Markets in the Division/Offices noted.
-
Time Frame: Current calendar year.
-
Note: Because we uploaded only wins before go live, the actual win rate before October 2019 is skewed. However, moving forward this will be much more accurate. You can look at any duration and express this as a % by count of opportunities as well.
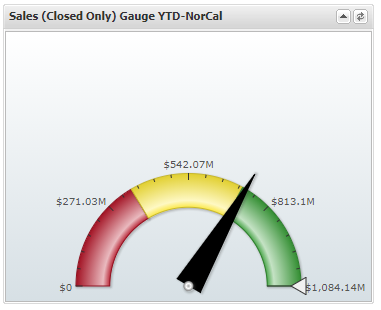
Sales (Closed Only) Gauge YTD
-
Shows: A quick view of where the Region, Division/Office, or department noted is compared to their overall sales goal.
-
Time Frame: Current calendar year.
-
Note: None.
Top Sales (Pending and Closed) by Opportunity YTD
-
Shows: Top 10 Sales for 10a-Pending and 10b-Closed by Potential Swinerton revenue amount.
-
Time Frame: Current calendar year.
-
Note: Can be shown by client or remove pending sales as well.