General Navigation
General Navigation
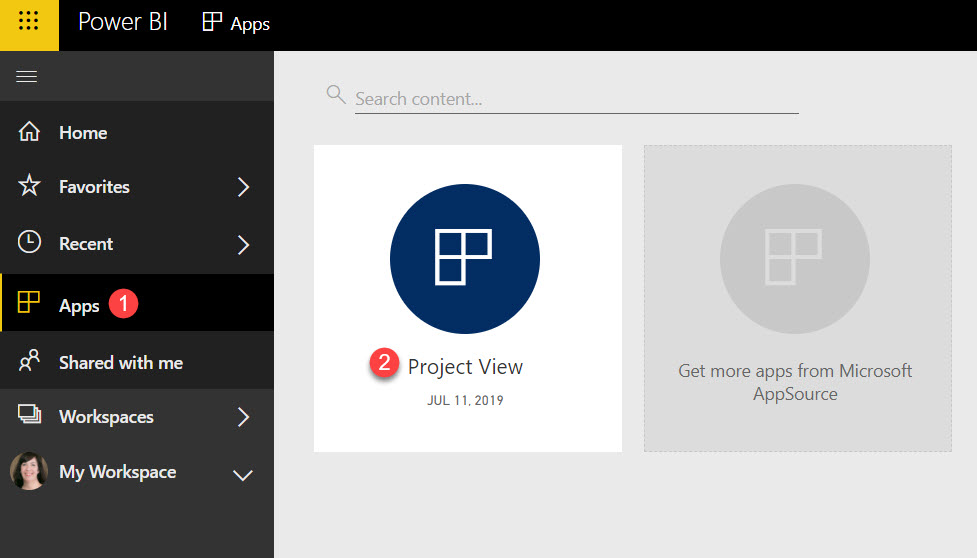
STEP 1: Click Apps on the treeview
STEP 2: Click the App you downloaded
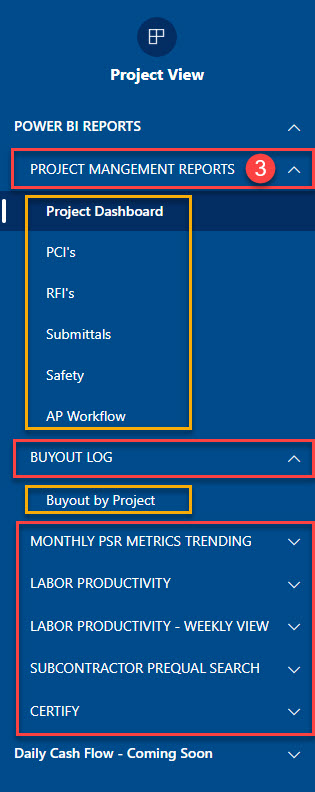
STEP 3: Click the down arrow for the report you want to review (In all Caps)
STEP 4: Choose the specific topic
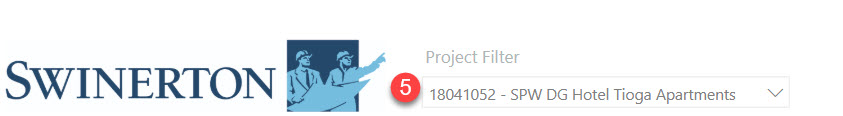
STEP 5: Select your filters
Note: Each report may have different filter choices depending on the data
Navigation buttons
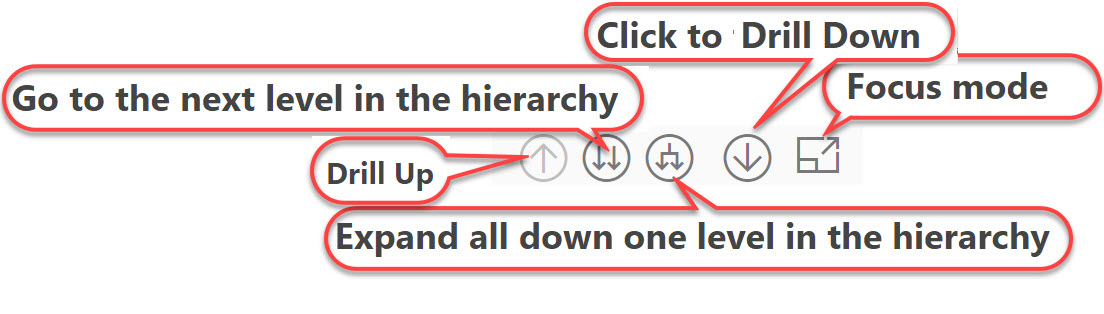
Up Arrow: Drill Up
Double Down Arrow: Drills all the way down to the final bit of detail for each graph
Connected Double Down Arrow: Drills all graphs down one level
Single Arrow Down: Drills down just one level
Focus Mode: Expands the box to full screen
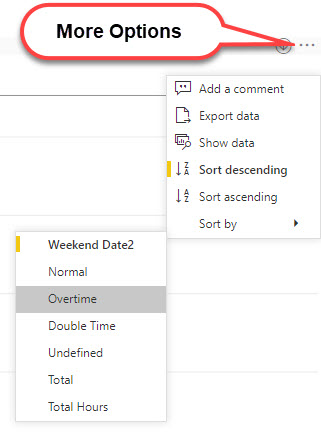
More Options (Ellipsis) : Allows you to move graphs for different views / Export Data to Excel / Show the data behind the graph
Setting Bookmarks
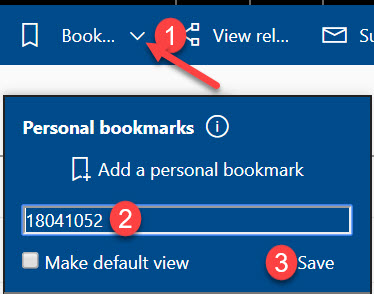
STEP 1: Click down arrow next to Bookmarks
STEP 2: Enter the name/number of your bookmark
STEP 3: Click Save
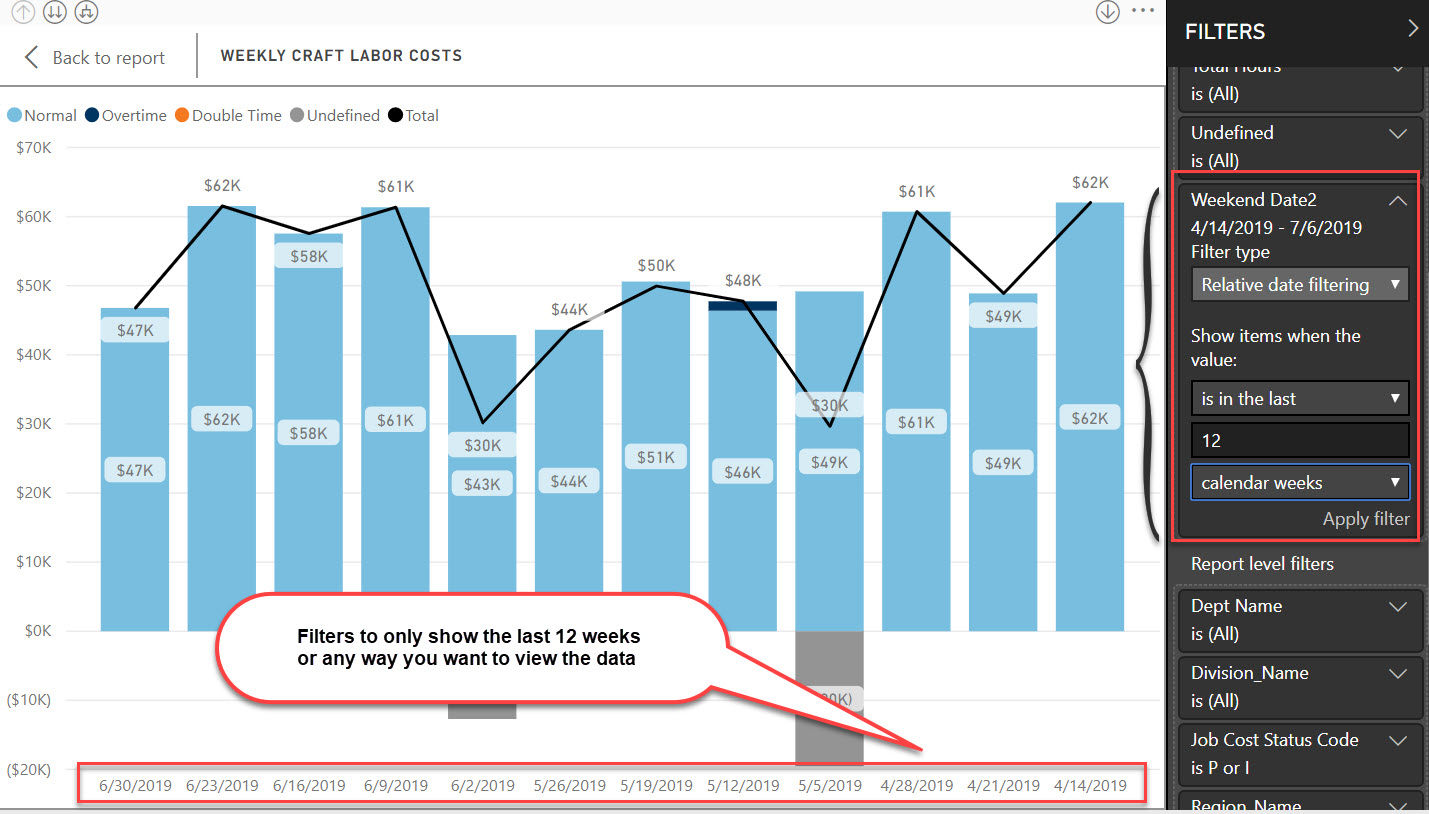
Filters
The reports are defaulted with specific filters, but you are welcome to change any of them
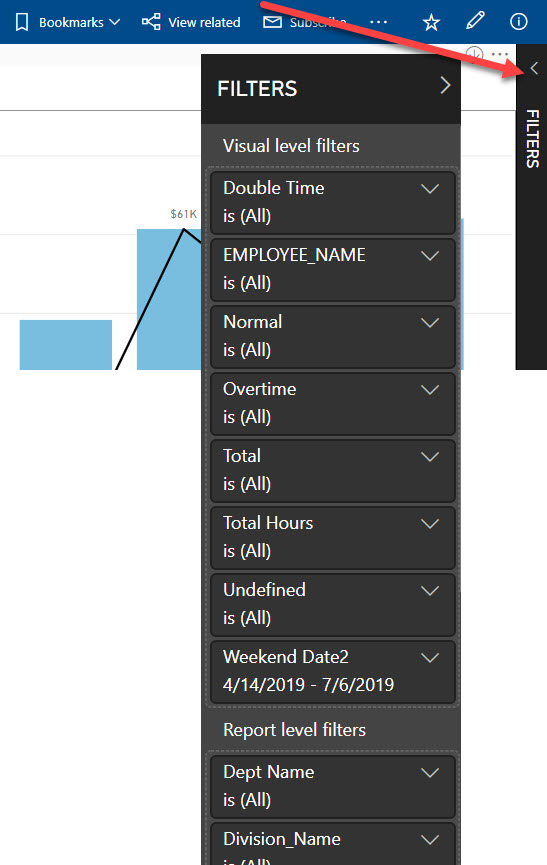
Filter Trick for Weekly Labor: If you only want to look at a specific amount of weeks/months, change the filter for the Weekend Date2 to "Relative Date Filtering" and set it to just what you want to see. Once you find a filter you like, set a bookmark or move the "Keep all filters" to ON