Add an image to a report
Here is a simple hack to add an image to any of your report. Often users wish to add the Swinerton Logo and this is an easy way to do it.
- Save the image you want to add in jpg format
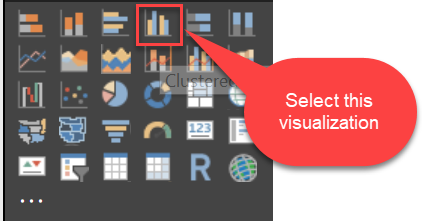
- Select Clustered Column chart in the visualization pane
- Add any field to the axis
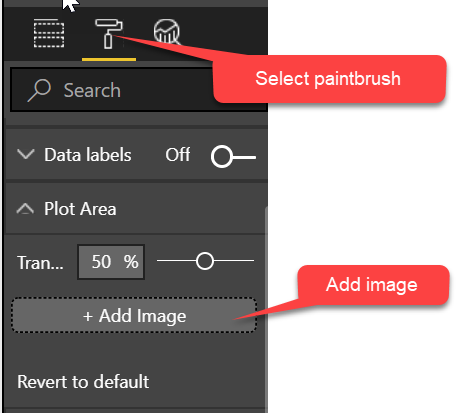
- Select paintbrush. Add image.
See the image in your report